Introduction to Colors on Computers

How to represent color
Humans are bad at describing colors.

In the above example, most people will call it “red”. However, on the computer, they’re 4 different colors.
There’re many methods to represent colors on a computer, the best-known one is the RGB model. RGB model “adds” colors so you can represent any color by adding 3 primary colors in the light which are red, blue, and green. Why these 3 colors you may ask? Because these 3 colors can stimulate 3 different cone cells, but this does not mean that these colors are the most sensitive ones to the cells.
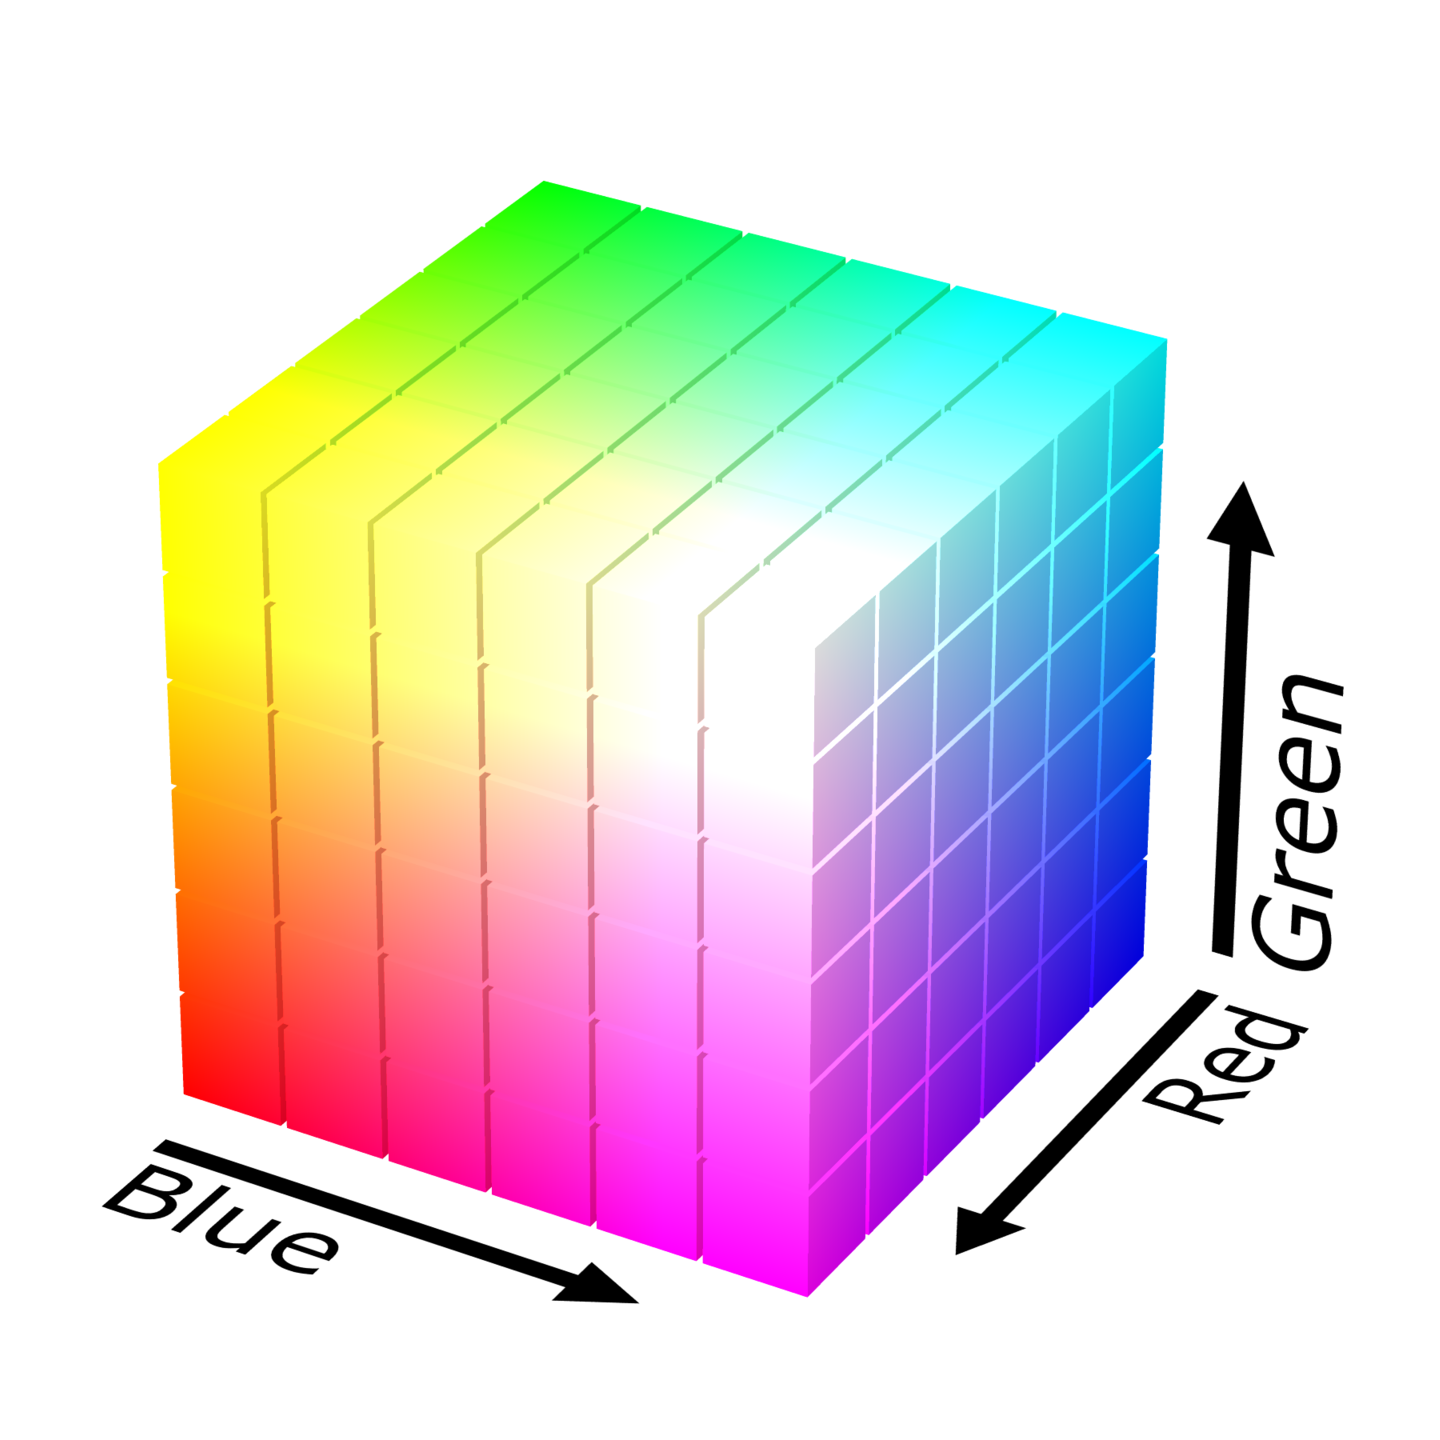
RGB model can be written in many ways. Take while as an example, you can represent it as (1.0,1.0,1.0), (255,255,255), (100%,100%,100%) etc. It’s obvious that the RGB model is related to the color space of the display devices. Different devices show RGB(255,255,255) in different color.
If we consider an 8-bit device, RGB model in theory can display 256*256*256 = 16,777,216 colors. In some web pages, however, we use webpage safe colors which are dramatically less than 16 million colors.
Although the RGB model is prevalent, it has some disadvantages. The most obvious one is that it’s not intuitive to humans. For example, it’s hard for people to come up with the value of “yellow” unless you’re familiar with adding color. That’s why we’re having a new color model called “HSL/HSV”.

It may look a bit complex at the first glance, but it’s more intuitive. H stands for Hue, it’s a circle where you represent colors by the angle. S stands for saturation, the closer you’re to the center of the circle, the less saturation you have. V stands for Value or L stands for Lightness, the higher you’re in the cylinder, the more lightness you have. For example, (60°,1.0,1.0) means the most saturated yellow with maximum lightness. HSL/HSV model is more common in design, like color grading in photography will usually apply this model since it’s easier for people to understand.
In most cases, HSL/HSV model is only used for presentation, when output to the display, we still apply the RGB model. Naturally, there’re equations to do that which we’re not going to discuss in this post.
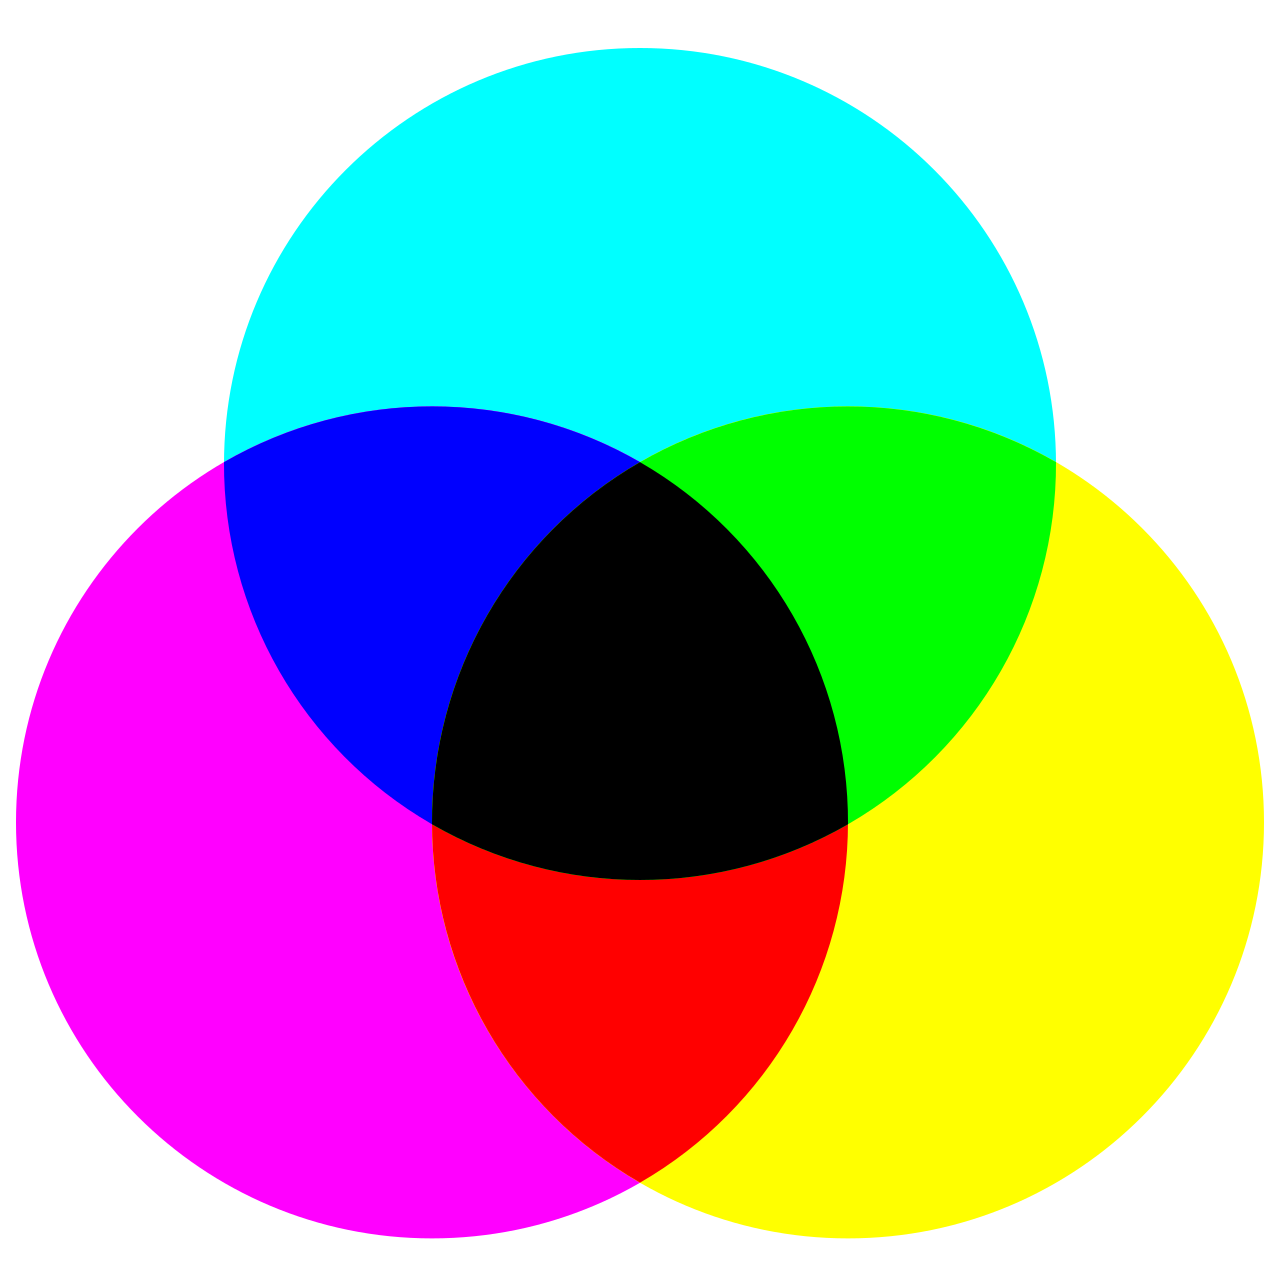
Apart from that, there’s one more model that is commonly used, CMYK. This one is widely used in the printing industry where most printers only have four basic colors: black(K), cyan(C), magenta(M), and yellow(Y). Similarly, you can mix these 4 colors to get different colors.
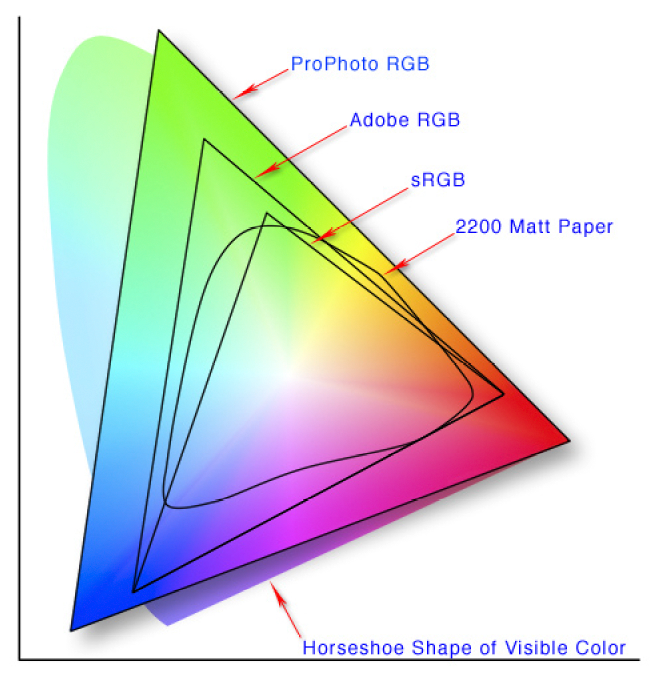
Remember we mentioned color space right? More people are probably more familiar with the word “Gamut”. Color space is defined by gamut and color model together. Many people mix the gamut and color space together since by default they mean RGB color model. Some common color spaces are sRGB, P3, Adobe RGB.
A common way to compare color space is to represent color spaces on a graph called “CIE1931 xy”. CIE1931 is the earliest color space using the mathematical definition in a 3D space. For simplicity, people project it on a 2D surface and using x and y to represent it, like a tongue.

The E point in the graph is called the “white point”. When we need to represent a color space, we only need to draw its border on the surface.
The last point I want to talk about is chroma subsampling which is widely used in compressing images or videos. How do we achieve that? We throw away some of the color information in an image or frame in a video since human eyes are more sensitive to brightness rather than color. By doing so, we can dramatically reduce the size of files without too many visual compromises.
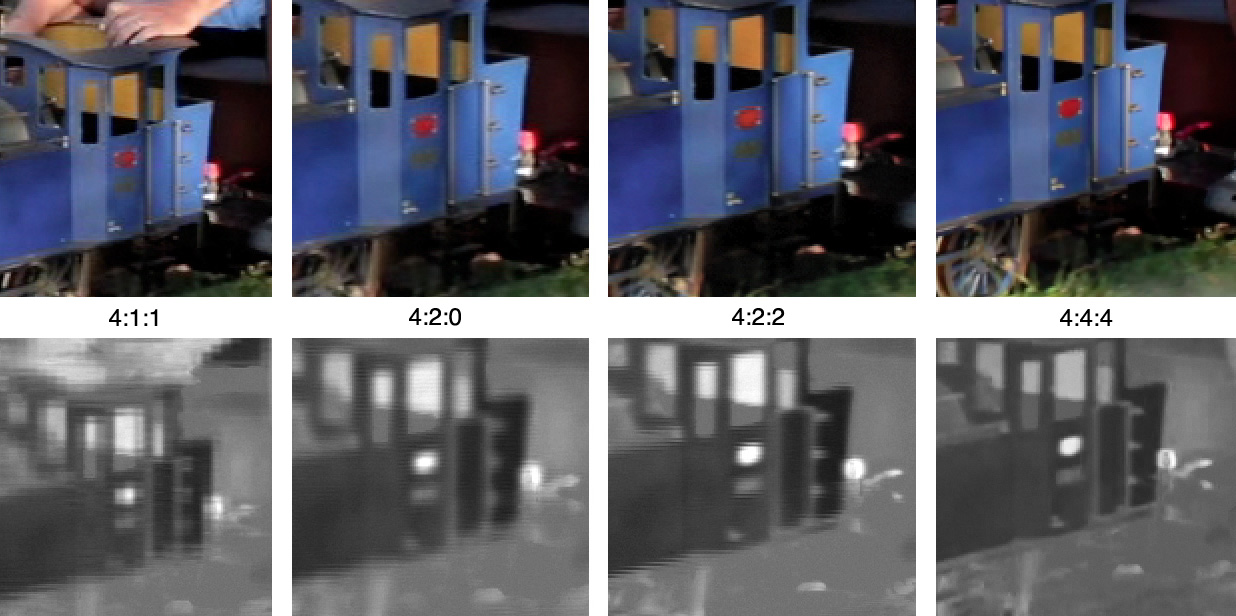
For example, the first row looks basically the same, however, the second row looks different since the resolution of colors is different.
Chroma subsampling is usually represented in the format of “J:a:b” where J means the longer side of the area contains J pixels, the height of the area is 2 pixels, J is usually 4. a means how many colors are in the first row of the area, b means how many colors in the second row is different from those in the first row. Sometimes there’s a fourth value which is called Alpha, which means horizontal factor. You can ignore this value as it’s the same as J.
The following graph shows some common chroma subsampling.

Most compressed images and videos are using this method so the colors you see may not be the same as the original data.
Explore more like this

Comments